A pain score graph sample showing pain levels, locations, severity colors, and multiple-location indicators arranged in clear chronological order.
756
Downloads
December 4, 2025
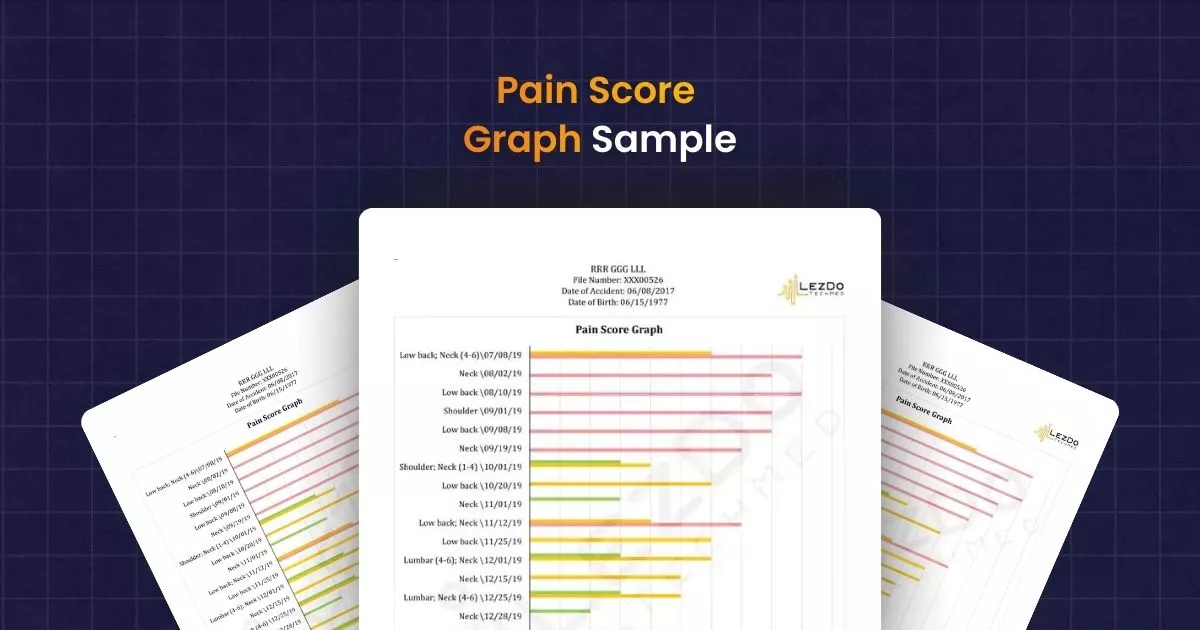

Shows pain scores and pain locations in one clear graph
Pain scores listed horizontally for easy comparison
Pain levels and locations arranged chronologically
Severity levels marked with distinct color codes
Multiple pain sites shown under one date with varied colors

Professional PDF document ready for immediate review

Actual case documentation produced by LezDo experts

Use as a reference for understanding our output quality
Understand the level of detail and organization we provide for case preparation
See how our summaries support claims evaluation and risk assessment
Review our approach to medical record organization and analysis
Assess our output quality before engaging with our services


Alpharetta, GA
New York City, NY
Encino, CA


© 2026 LezDo TechMed LLC. All rights reserved.